Trimaran: Load-aware scheduling plugins #
Trimaran is a collection of load-aware scheduler plugins described in Trimaran: Real Load Aware Scheduling.
Currently, the collection consists of the following plugins.
TargetLoadPacking: Implements a packing policy up to a configured CPU utilization, then switches to a spreading policy among the hot nodes. (Supports CPU resource.)LoadVariationRiskBalancing: Equalizes the risk, defined as a combined measure of average utilization and variation in utilization, among nodes. (Supports CPU and memory resources.)LowRiskOverCommitment: Evaluates the performance risk of overcommitment and selects the node with lowest risk by taking into consideration (1) the resource limit values of pods (limit-aware) and (2) the actual load (utilization) on the nodes (load-aware). Thus, it provides a low risk environment for pods and alleviate issues with overcommitment, while allowing pods to use their limits.
The Trimaran plugins utilize a
load-watcher to access resource utilization data via metrics providers. Currently, the load-watcher supports three metrics providers:
Kubernetes Metrics Server,
Prometheus Server, and
SignalFx.
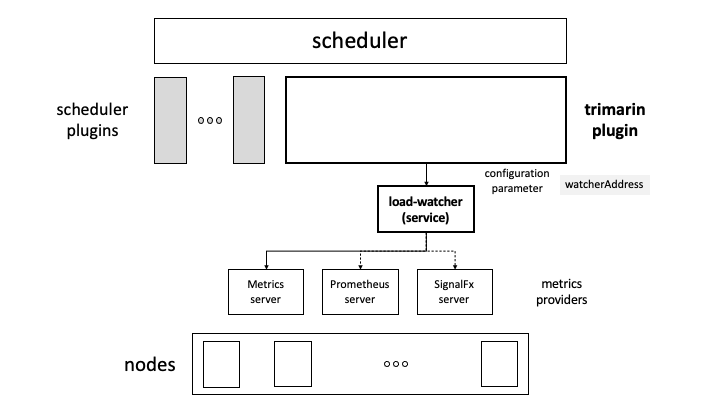
There are two modes for a Trimaran plugin to use the load-watcher: as a service or as a library.
load-watcher as a service #
In this mode, the Trimaran plugin uses a deployed load-watcher service in the cluster as depicted in the figure below. A watcherAddress configuration parameter is required to define the load-watcher service endpoint. For example,
watcherAddress: http://xxxx.svc.cluster.local:2020
Instructions on how to build and deploy the load-watcher can be found
here. The load-watcher service may also be deployed in the same scheduler pod, following the tutorial
here.
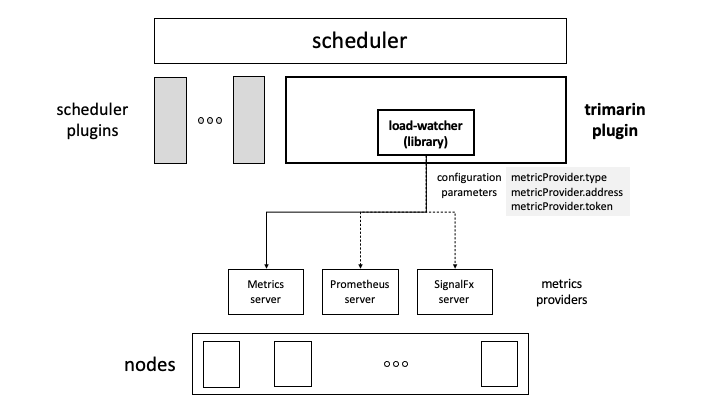
load-watcher as a library #
In this mode, the Trimaran plugin embeds the load-watcher as a library, which in turn accesses the configured metrics provider. In this case, we have three configuration parameters: metricProvider.type, metricProvider.address and metricProvider.token.
The configuration parameters should be set as follows.
metricProvider.type: the type of the metrics providerKubernetesMetricsServer(default)PrometheusSignalFx
metricProvider.address: the address of the metrics provider endpoint, if needed. For the Kubernetes Metrics Server, this parameter may be ignored. For the Prometheus Server, an example setting ishttp://prometheus-k8s.monitoring.svc.cluster.local:9090
metricProvider.token: set only if an authentication token is needed to access the metrics provider.
The selection of the load-watcher mode is based on the existence of a watcherAddress parameter. If it is set, then the load-watcher is in the ‘as a service’ mode, otherwise it is in the ‘as a library’ mode.
In addition to the above configuration parameters, the Trimaran plugin may have its own specific parameters.
Following is an example scheduler configuration.
apiVersion: kubescheduler.config.k8s.io/v1
kind: KubeSchedulerConfiguration
leaderElection:
  leaderElect: false
profiles:
- schedulerName: trimaran
  plugins:
    score:
      enabled:
       - name: LoadVariationRiskBalancing
  pluginConfig:
  - name: LoadVariationRiskBalancing
    args:
      metricProvider:
        type: Prometheus
        address: http://prometheus-k8s.monitoring.svc.cluster.local:9090
      safeVarianceMargin: 1
      safeVarianceSensitivity: 2
Configure Prometheus Metric Provider under different environments #
-
Invalid self-signed SSL connection error for the Prometheus metric queries The Prometheus metric queries may have invalid self-signed SSL connection error when the cluster environment disables the skipInsecureVerify option for HTTPs. In this case, you can configure
insecureSkipVerify: trueformetricProviderto skip the SSL verification.args: metricProvider: type: Prometheus address: http://prometheus-k8s.monitoring.svc.cluster.local:9090 insecureSkipVerify: true -
OpenShift Prometheus authentication without tokens. The OpenShift clusters disallow non-verified clients to access its Prometheus metrics. To run the Trimaran plugin on OpenShift, you need to set an environment variable
ENABLE_OPENSHIFT_AUTH=truefor your trimaran scheduler deployment when run load-watcher as a library.
A note on multiple plugins #
The Trimaran plugins have different, potentially conflicting, objectives. Thus, it is recommended not to enable them concurrently. As such, they are designed to each have its own load-watcher.